Before you start
Who this document is for: B2B company CEOs who are considering SEO as an acquisition channel and want to understand what they are buying before signing anything, and marketing directors who need to design, deploy and defend this strategy in front of their leadership.
Is B2B SEO even the right channel for you?
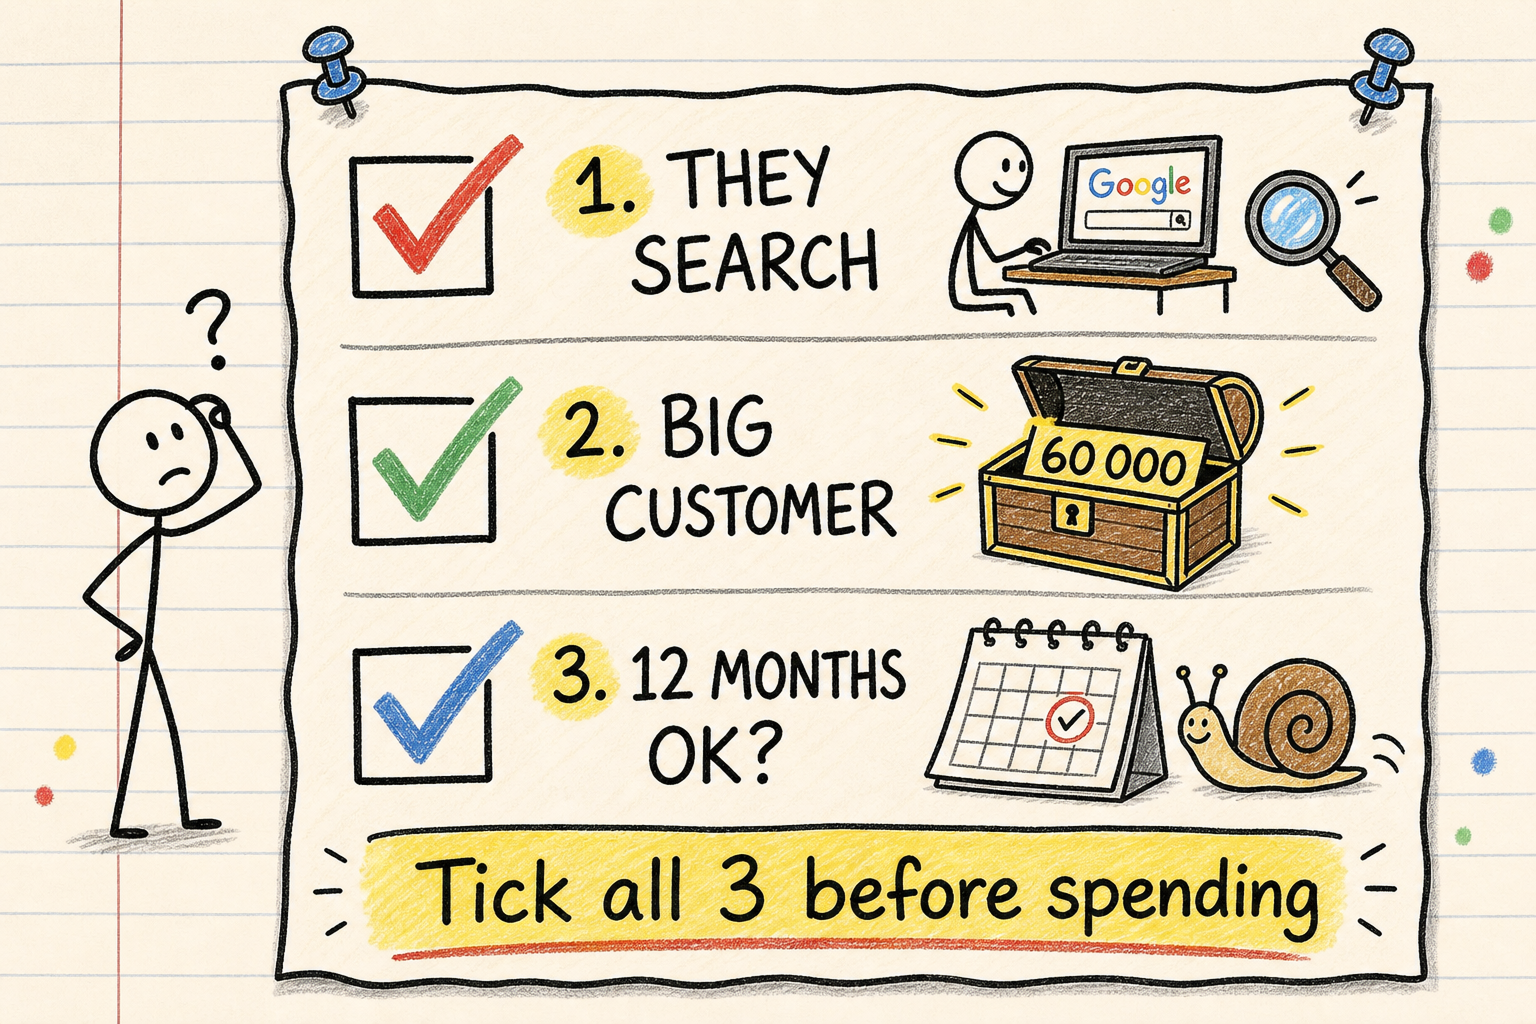
A question that is rarely asked, yet it decides everything. SEO is not a universal channel. It works under three conditions.
Condition 1: your prospects are actively searching. SEO captures existing demand, it does not create demand. If your market types queries into Google (“maintenance management software”, “supply chain consulting firm”, “precision machining subcontractor”), SEO can intercept them. If your offer is so new that nobody knows how to search for it, SEO alone will not be enough: you will first need to create the category through other channels (outbound, events, brand content), and SEO will capture the demand once it exists.
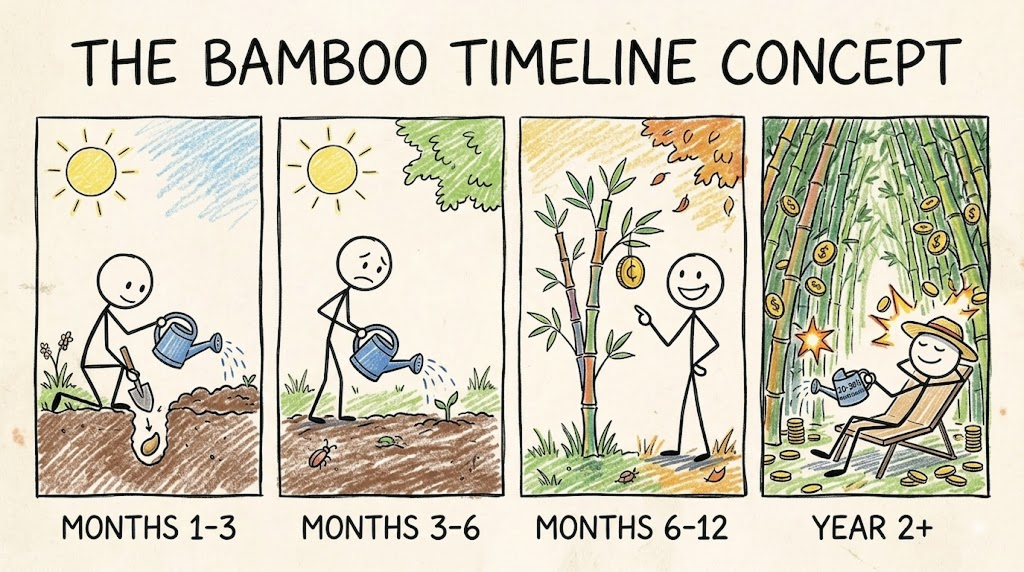
Condition 2: your customer value absorbs the delay. SEO produces its effects between month 6 and month 12. During that time, you invest with no return. That delay is only bearable if the value of one customer justifies it. A customer worth 30,000, 80,000 or 200,000 euros in lifetime value makes the equation obvious. A 500 euro customer makes it impossible in B2B.
Condition 3: you accept a 12-month game, minimum. SEO is an asset. Like any asset, it is slow to build and pays for a long time. A company that needs leads in 60 days must do outbound or paid. It can launch SEO in parallel, but never instead.
The economics, laid out cold
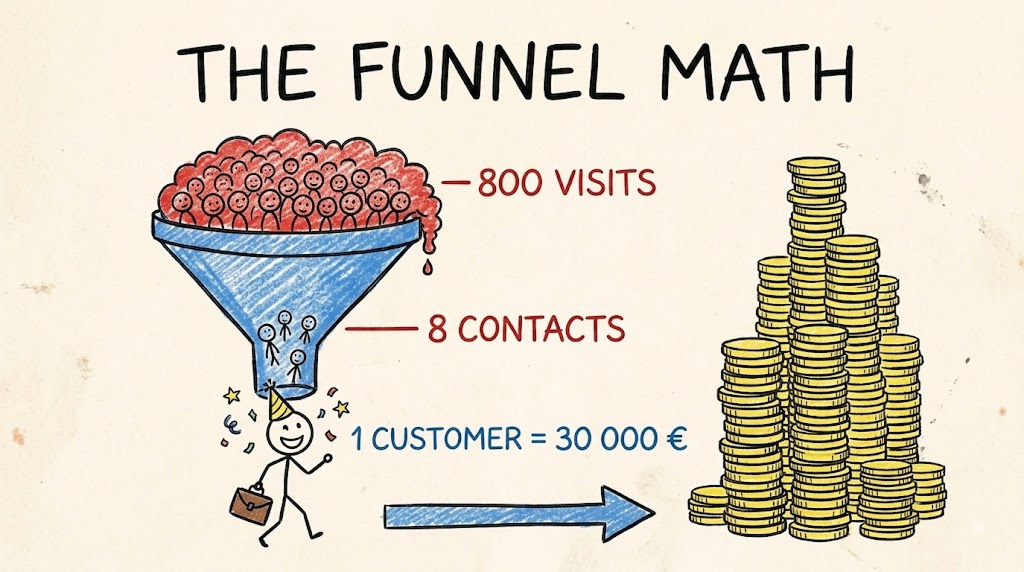
Let’s run the calculation a CEO should demand before any commitment. Take a B2B company whose average customer is worth 60,000 euros in lifetime value, with 50% gross margin, so 30,000 euros of margin per customer.
Conservative assumptions for a structured SEO program:
- Investment: between 2,000 and 5,000 euros per month (in-house, agency or hybrid) for 12 months, so 24,000 to 60,000 euros in year one
- Realistic result at 12 months for a properly architected site in a niche market: between 800 and 3,000 qualified organic visits per month
- Visit-to-contact conversion rate on well-designed transactional pages: 1 to 3%
- Contact-to-customer rate in B2B: 10 to 25% depending on sales strength
Low end: 800 visits × 1% × 10% = almost 1 customer per month starting at month 12. High end: 3,000 × 3% × 25% = more than 20 customers per month. The reality for most B2B SMBs sits between 1 and 4 customers per month from organic once at cruising speed.
At 30,000 euros of margin per customer, 2 customers per month represent 720,000 euros of annual margin for a channel that costs 30,000 to 60,000 euros per year, with a marginal cost that decreases over time. That is why B2B SEO, when the three conditions are met, is structurally the most profitable channel at the 24-month mark. And why it is a disaster when they are not: the same investment in a market with no search demand, or with too small a deal size, will never return anything.
The point the CEO must verify personally: run this calculation with your own numbers before meeting a single vendor. If the equation does not hold with conservative assumptions, no agency will make it hold.
What this playbook is not
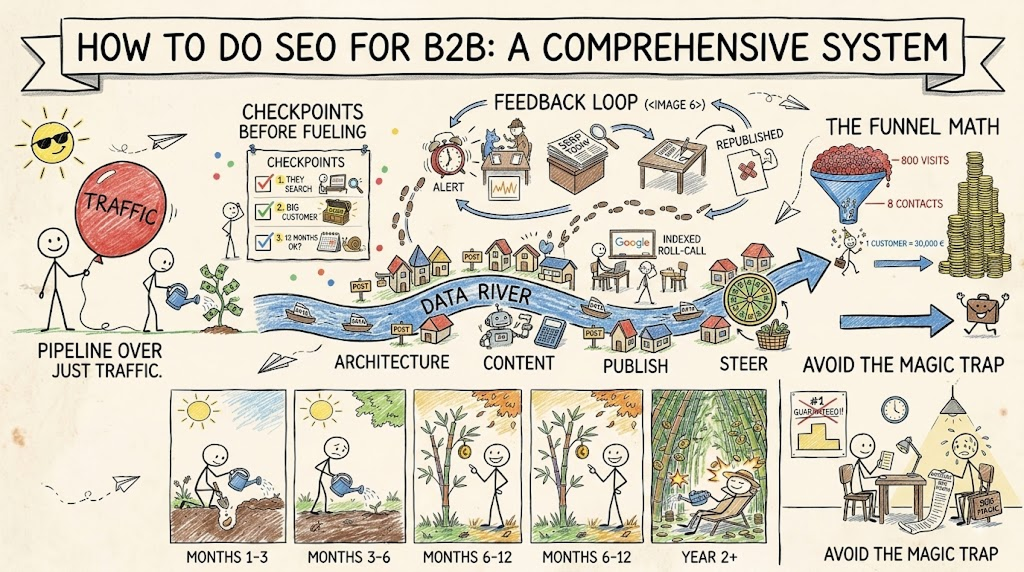
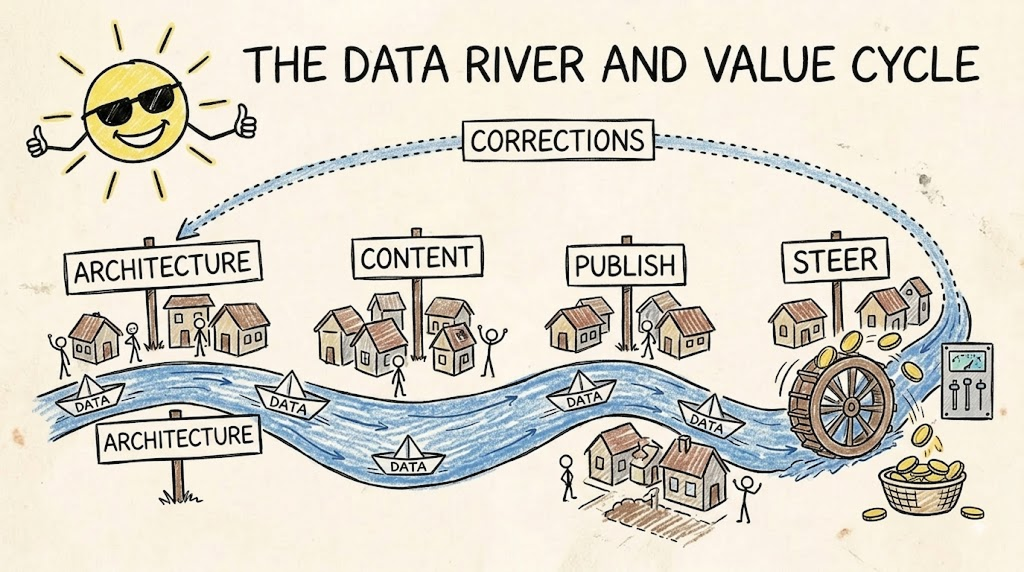
This is not a list of tricks. There is nothing here about “the 10 SEO hacks of 2026”. This is an industrial method in 4 phases, where each phase builds on the data produced by the previous one, never on intuition. Build the architecture, produce the content, publish, steer over time. In that order, no exceptions.
The principle that governs everything: deterministic first, AI second
Before the phases, one transversal rule that separates a serious method from a fragile one.
An SEO strategy chains together dozens of decisions: which keywords to group on the same page, what architecture to give the site, which planned page matches which live URL, when to raise an alert on a decline. The question to ask about every one of these decisions: is it reproducible?
Structural decisions must be deterministic. Keyword grouping by statistical clustering on real data. Page matching by measurable text similarity. Alerts by comparing windows of data. Re-run the calculation tomorrow with the same data, you get the same result. You can audit, correct, justify.
AI intervenes only where it excels: naming groups that already exist, writing content from a structured brief, detecting differentiation angles in competitor content. Never to settle questions of structure.
Why this distinction matters to a CEO: a reproducible method can be steered and handed over. If your SEO manager leaves, if you change agencies, if a result surprises you, you can trace every decision back to the data that motivated it. A method that relies on unconstrained AI generation produces different results on every run: you never know whether a performance change came from the market or from the tool’s randomness. You cannot steer what you cannot reproduce.
It is also a cost question: deterministic computation costs cents where massive AI calls cost hundreds of euros. A method that burns AI on statistical tasks is billing you for its own inefficiency.

Phase 1: Build the architecture before writing a single line
The problem this phase solves
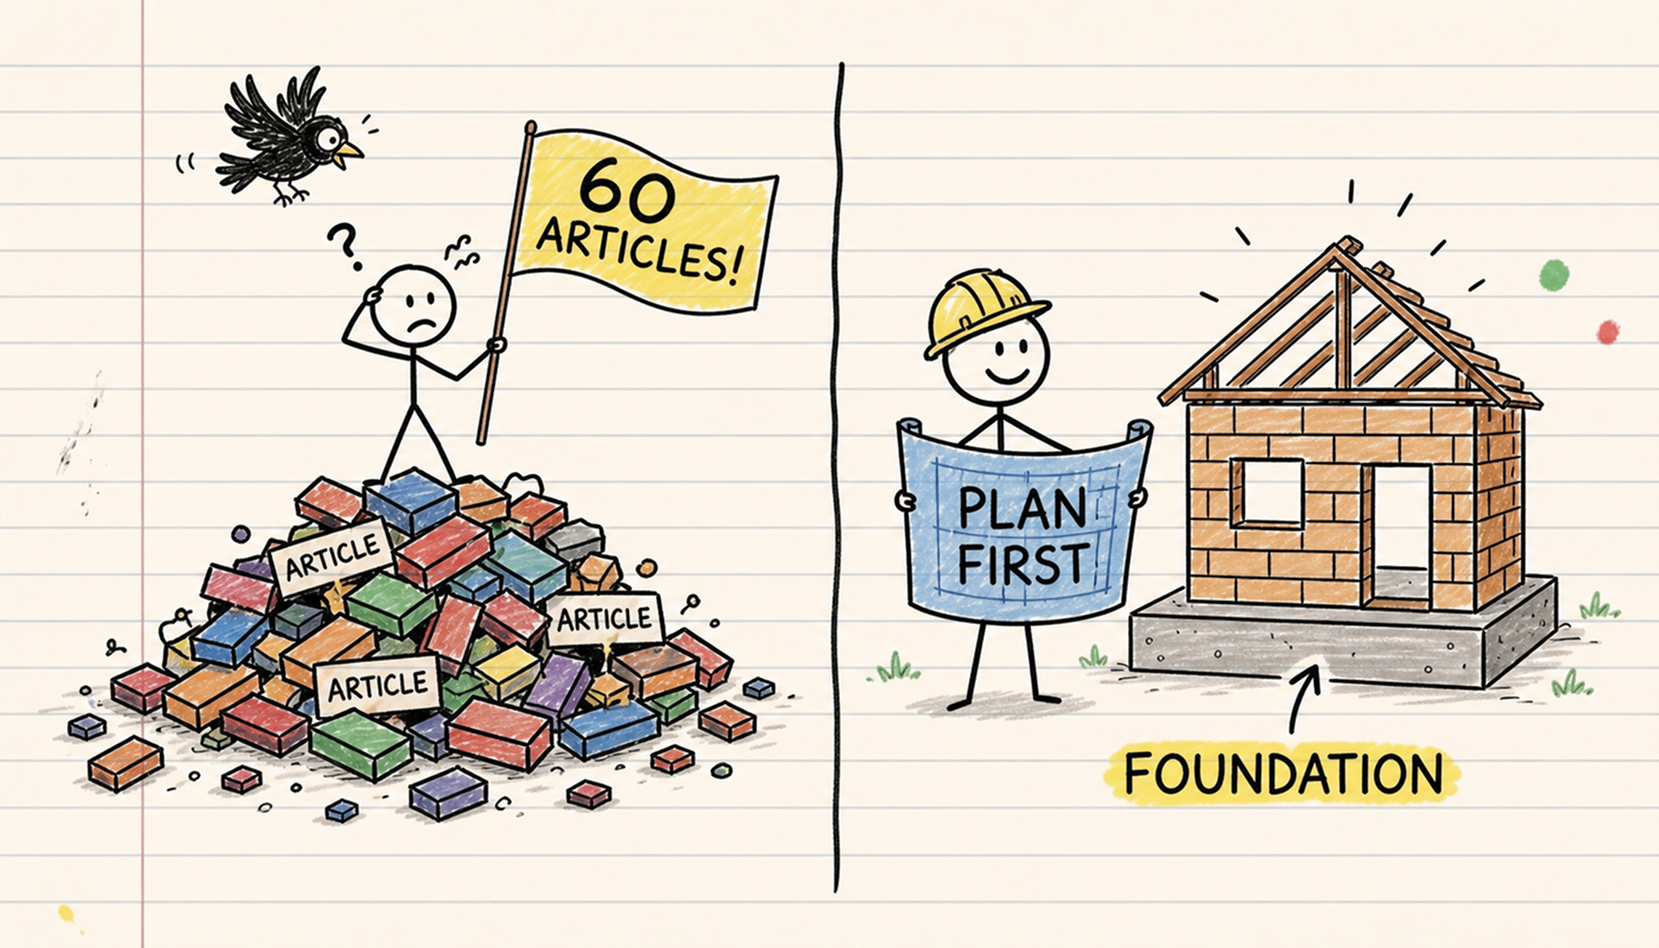
Here is how 90% of B2B companies do SEO: marketing identifies “relevant topics”, orders articles, publishes them as they come. Twelve months later: 60 articles online, anemic traffic, zero attributable leads.
Three causes, always the same. The articles cannibalize each other (several pages of the same site fight over the same queries, Google hesitates, none of them ranks). The site has no thematic structure (Google cannot tell what the company is a reference for). The keywords were chosen by intuition (pages target queries nobody types, or queries everybody types with no buying intent).
Phase 1 eliminates these three causes before a single euro of production is spent. It lasts 2 to 3 weeks and produces no content. That is deliberate. This is the phase where 80% of the final result is decided.
Step 1.1: Start from real search data
Everything starts with an exhaustive export of your market’s search data: every query, its real monthly volume, its seasonality, its advertising cost (CPC is an excellent indicator of commercial value: if your competitors pay 15 euros per click on a query, that query generates business).
Two B2B rules at this stage.
Do not filter by volume. In B2C, a keyword with 90 monthly searches is ignored. In B2B, it can be your absolute priority. “Pharmaceutical regulatory management software” gets maybe 70 searches per month. But every one of those 70 searches is a regulatory affairs manager with a budget. One single contract pays back three years of SEO. Volume measures the size of the audience, not its value.
Cross volume with value. For every keyword, the question is not “how many people type it” but “what is the person typing it worth”. A simple table is enough: volume × estimated value of the searcher × probability of buying intent. That score, not raw volume, sets the priorities.
Step 1.2: Group keywords into clusters, then validate with the SERPs
A B2B market easily produces 2,000 to 15,000 relevant keywords. Impossible to handle one by one. They are grouped automatically by semantic proximity: a statistical clustering algorithm (deterministic, reproducible) builds groups of queries that talk about the same thing. AI only steps in to give a readable name to each group already formed.
Then comes the validation that separates serious methods from the rest: validation against real Google results.
The principle: two keywords should be handled by the same page if, and only if, Google shows the same results for both. We analyze the pages that actually rank for each query. If “CMMS software” and “maintenance management software” bring up the same sites on page one, a single page will capture both. If “CMMS for SMBs” and “CMMS for manufacturing” show different results, two pages are needed, even if the terms look close.
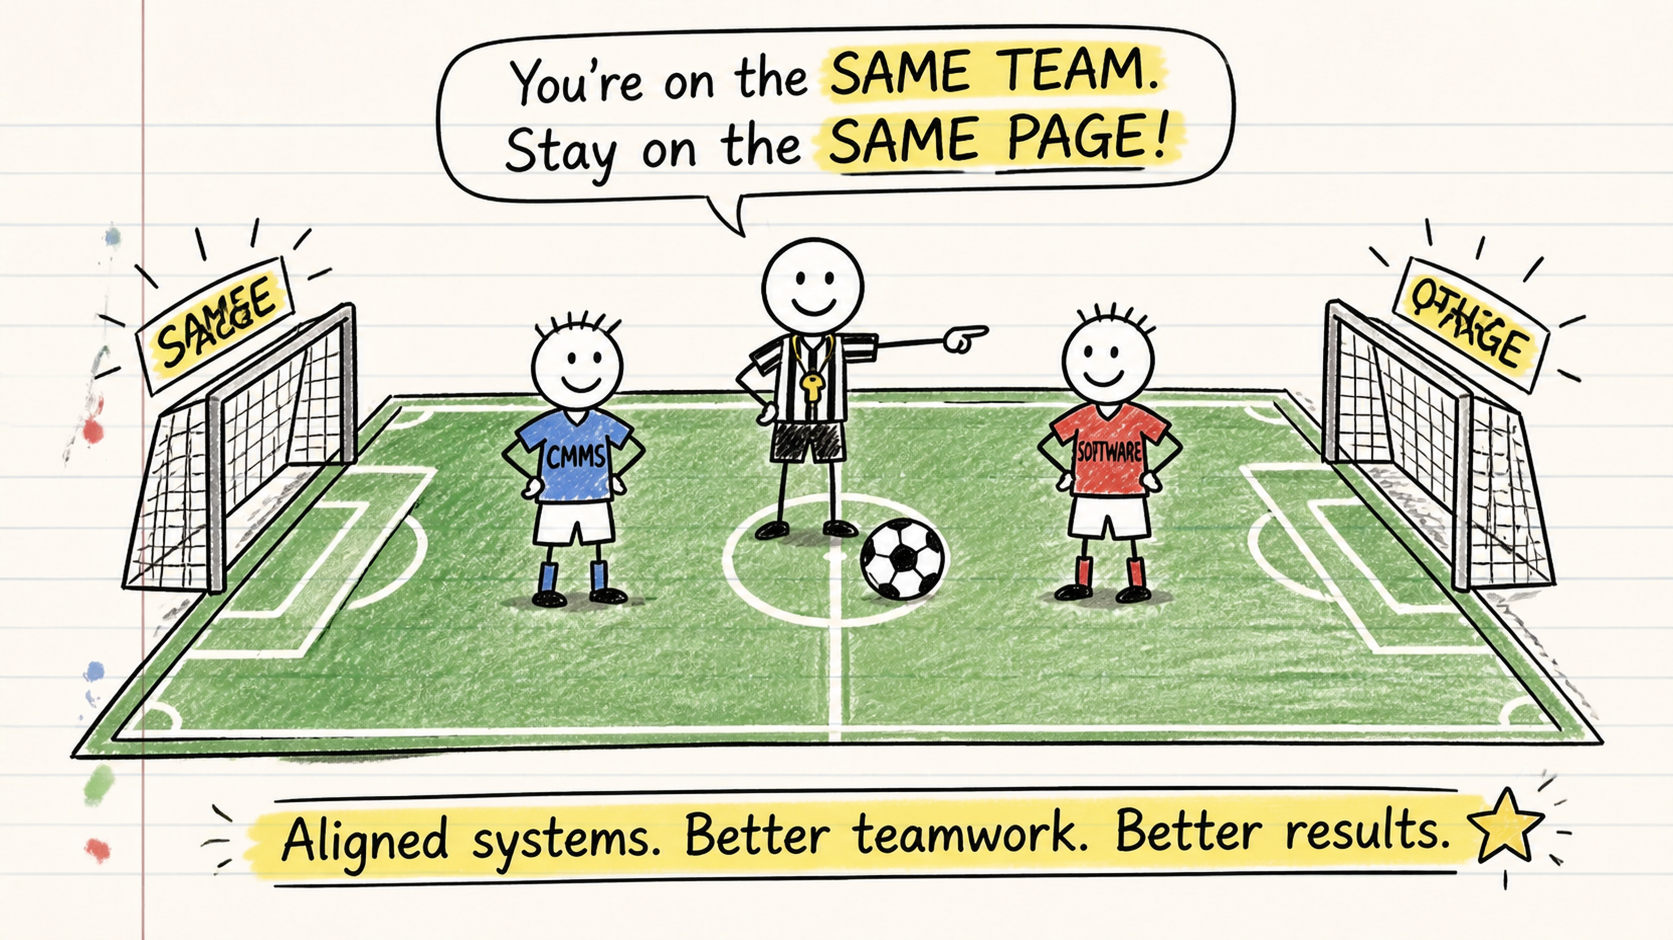
Why this is decisive: semantic proximity and Google’s behavior diverge in 20 to 30% of cases. An architecture built on semantics alone therefore contains 20 to 30% of wrong decisions at its root: pages merged that should have been separated (you lose rankings), pages separated that should have been merged (you create cannibalization). Google decides, never an intuition, never a language model.
Step 1.3: Classify search intent
Every keyword is then classified by intent, also measured on real results:
Informational: the searcher wants to understand (“what is predictive maintenance”, “machine safety regulations”). Commercial: they are comparing (“best CMMS software”, “CMMS vs Excel”, “manufacturing ERP comparison”). Transactional: they are looking for a provider (“CMMS software pricing”, “CMMS vendor”, “maintenance software demo”).
The classification method is concrete: look at what Google displays. If page one is full of guides and Wikipedia articles, the intent is informational and a commercial page will never rank there. If it is full of product pages and comparisons, the intent is commercial. The format of the pages that rank dictates the format of the page to produce.
In B2B, this classification has a direct budget translation: transactional pages are few, hard, and worth gold. Informational pages are many, more accessible, and feed the top of the journey. A balanced program produces both, but measures their performance differently (more on this in Phase 4).
Step 1.4: Map the buying journey of each persona
Here is the step almost no SEO program executes, and it is the difference between traffic and pipeline.
In B2B, there is no such thing as one buyer. There is a buying committee. Take a manufacturing SMB considering maintenance software: the maintenance manager lives the problem daily, the plant director arbitrates priorities, the CEO or CFO signs. Three people, three vocabularies, three moments of entry into the topic, three different sets of Google queries.
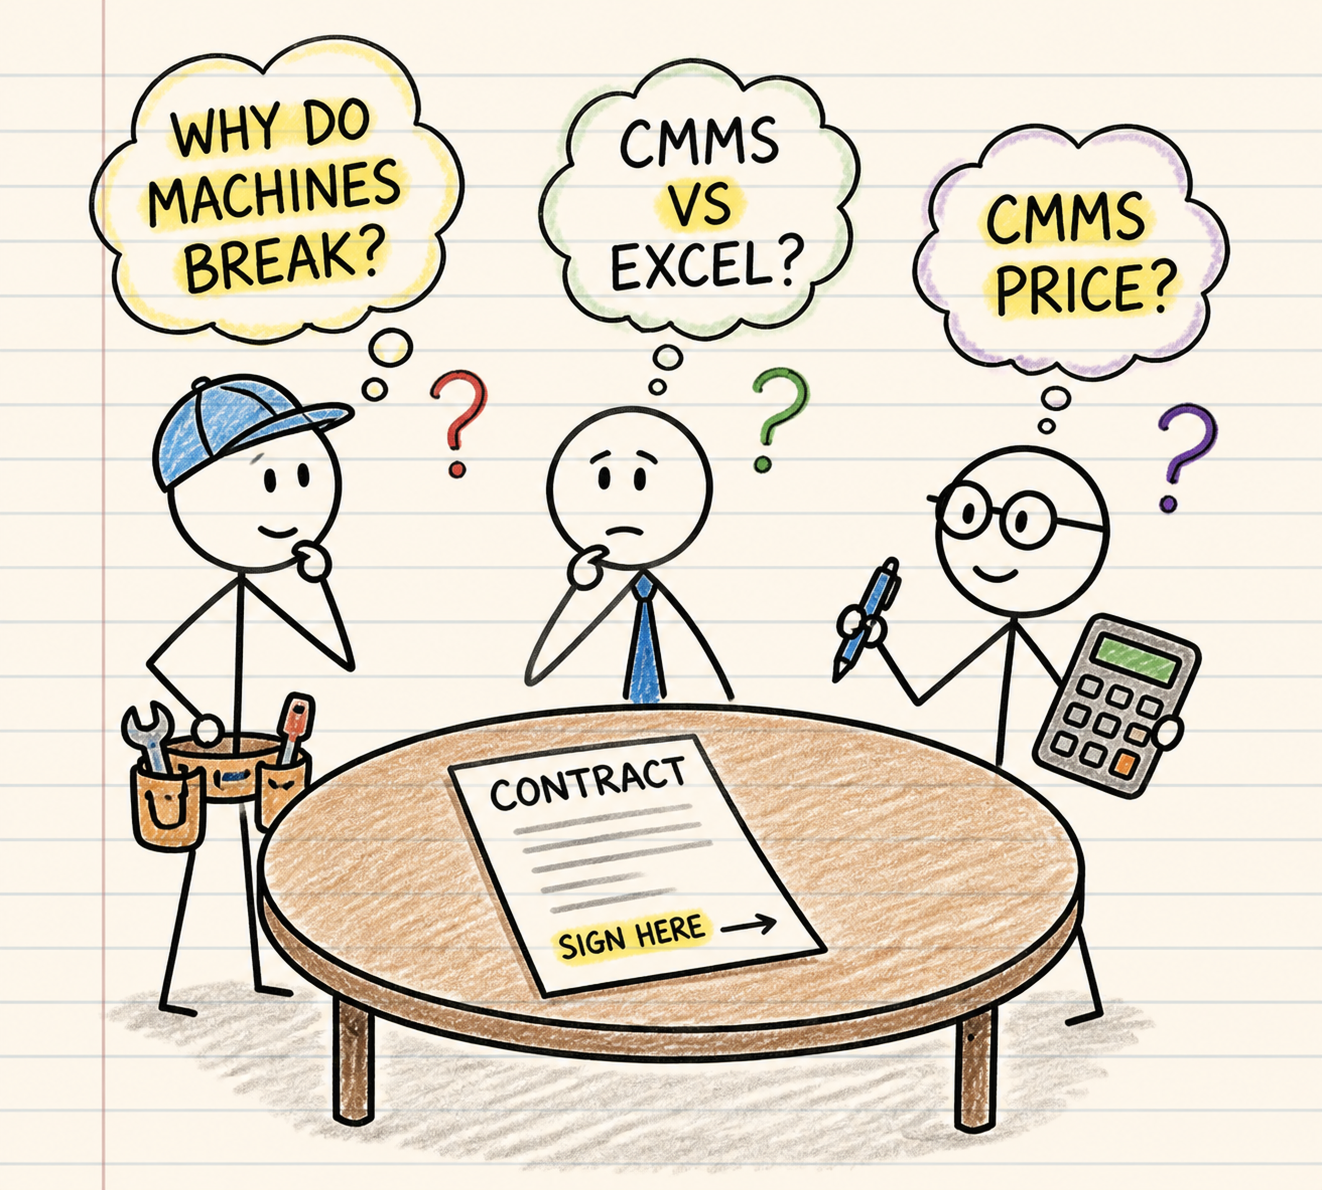
Formalize the personas. For each persona in the buying committee, document: their role in the decision (initiator, influencer, decision-maker, payer), their pain expressed in their own words, their typical objections, their search vocabulary. Three to five personas cover almost every B2B company. Beyond that, you dilute. And have them validated by the sales team: they talk to real buyers every day, and a persona a salesperson does not recognize is an invented persona.
Map the awareness levels. Each persona moves through five levels of awareness, and each level corresponds to different queries:
- Unaware. They live the problem without naming it. They search for nothing, or for symptoms: “reduce machine downtime”, “why is my production always late”. The biggest and least exploited level.
- Problem-aware. They have put a word on their pain: “cost of corrective maintenance”, “how to organize preventive maintenance”. They want to understand, not to buy.
- Solution-aware. They know a category of solutions exists: “CMMS software”, “what does a CMMS do”. They compare approaches (software vs Excel vs outsourcing).
- Product-aware. They compare vendors: “best CMMS for SMBs”, “CMMS comparison”, “[competitor] reviews”, “[competitor] alternative”. They look for proof and differences.
- Most aware. They want to make contact: “CMMS pricing”, “CMMS demo”, “CMMS vendor France”. These queries get 30 searches a month and are worth more than everything else.
Cross the two: the persona × awareness matrix. Every keyword cluster from step 1.2 is placed in one cell of the matrix. “Why do my machines keep breaking down”: maintenance manager, problem level. “CMMS pricing”: CFO or CEO, most-aware level. “CMMS vs Excel”: maintenance manager or plant director, solution level.
This matrix produces four concrete effects.
Every page knows who it is talking to. Tone, technical depth, examples are calibrated for one precise reader. A page for the maintenance manager talks downtime and intervention schedules. A page for the CFO talks total cost of ownership and payback. The “average reader” does not exist, and pages written for him convince no one.
Every page carries the right call to action. This is where most B2B sites destroy their conversion. Offering a sales meeting to a problem-level reader makes them flee: they do not even know a solution exists yet. Offering them a guide or a diagnostic moves them up one level. Conversely, burying a most-aware reader under educational content instead of giving them a booking button loses a hot deal. The rule: a page’s CTA matches the awareness level of its cell, never the company’s desire to sell fast.
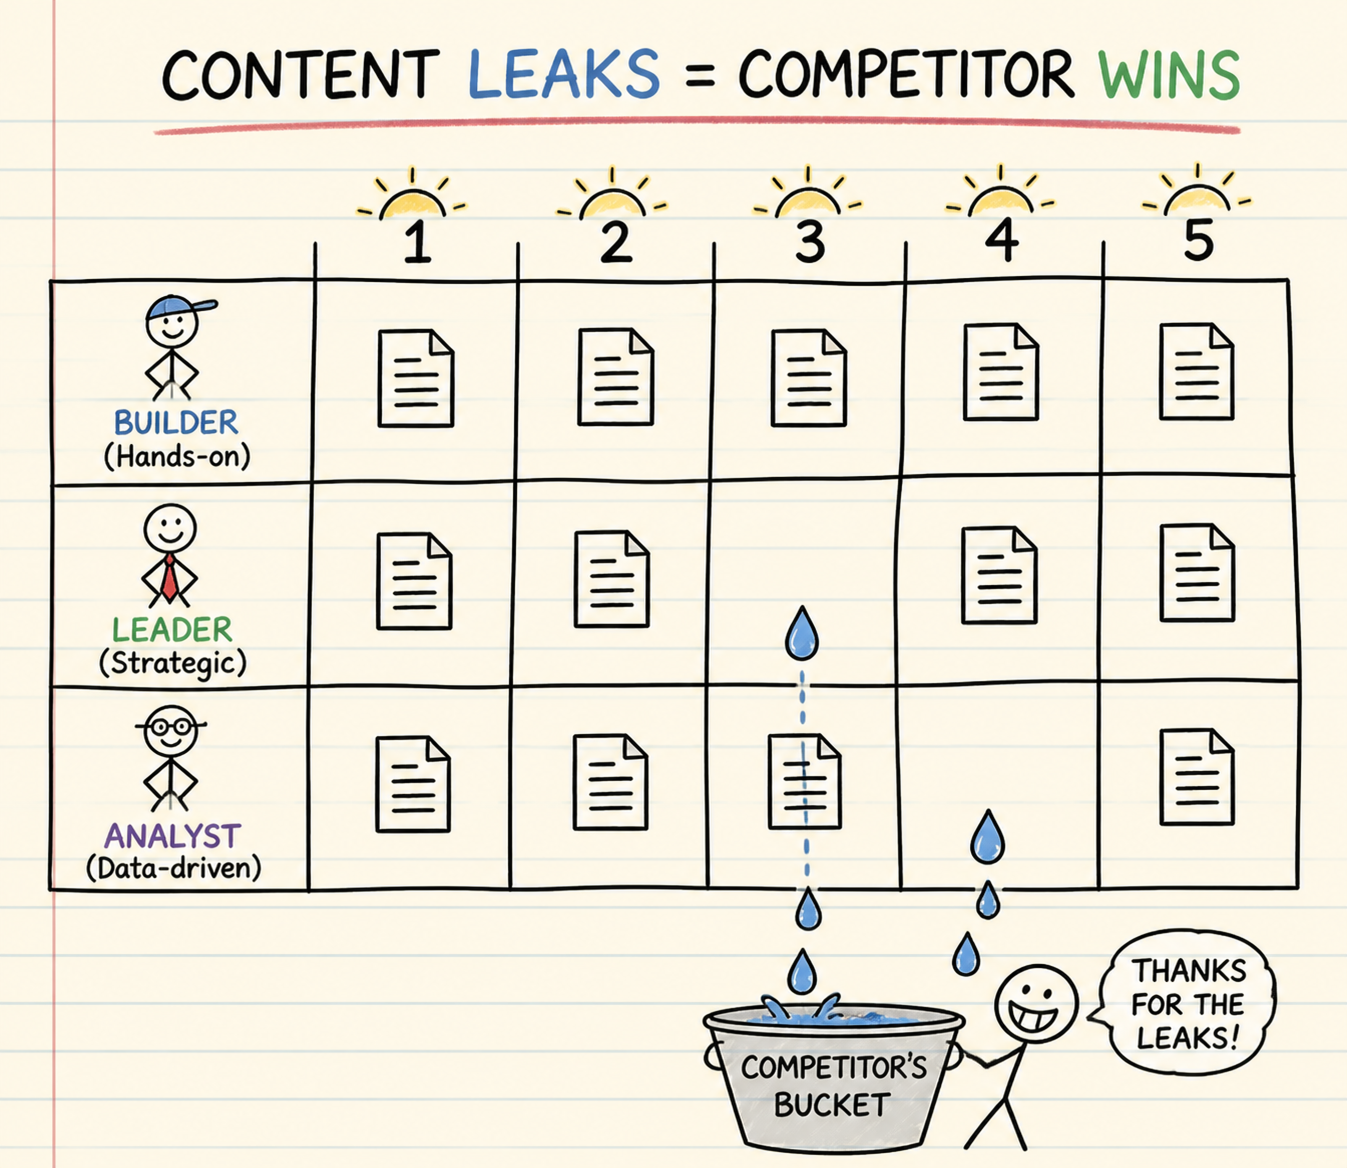
Journey gaps become visible. Display the matrix: personas as rows, levels as columns, number of pages per cell. Empty cells are pipeline leaks. If your maintenance manager has 12 pages at the problem level and zero at the product level, he discovers the topic with you, then compares vendors with a competitor who wrote the comparisons. You educated the market for someone else. The matrix reveals these leaks before they cost deals, not after.
Internal linking follows the progression. A problem-level page links to the solution-level pages of the same persona, which link to the product pages. The reader who advances in his thinking advances through your site. Linking stops being decorative, it reproduces the buying journey.
Step 1.5: Build the semantic cocoon
The validated, classified and mapped clusters become a tree: Site → Cocoons → Pillar pages → Satellite pages.
A semantic cocoon is a complete thematic territory. The pillar is the reference page of the topic (often commercial or transactional: “CMMS Software”). The satellites each handle one precise facet (“CMMS for SMBs”, “CMMS pricing”, “Migrating from Excel to a CMMS”, “CMMS and predictive maintenance”) and all link to their pillar. The pillar concentrates the authority the satellites accumulate.
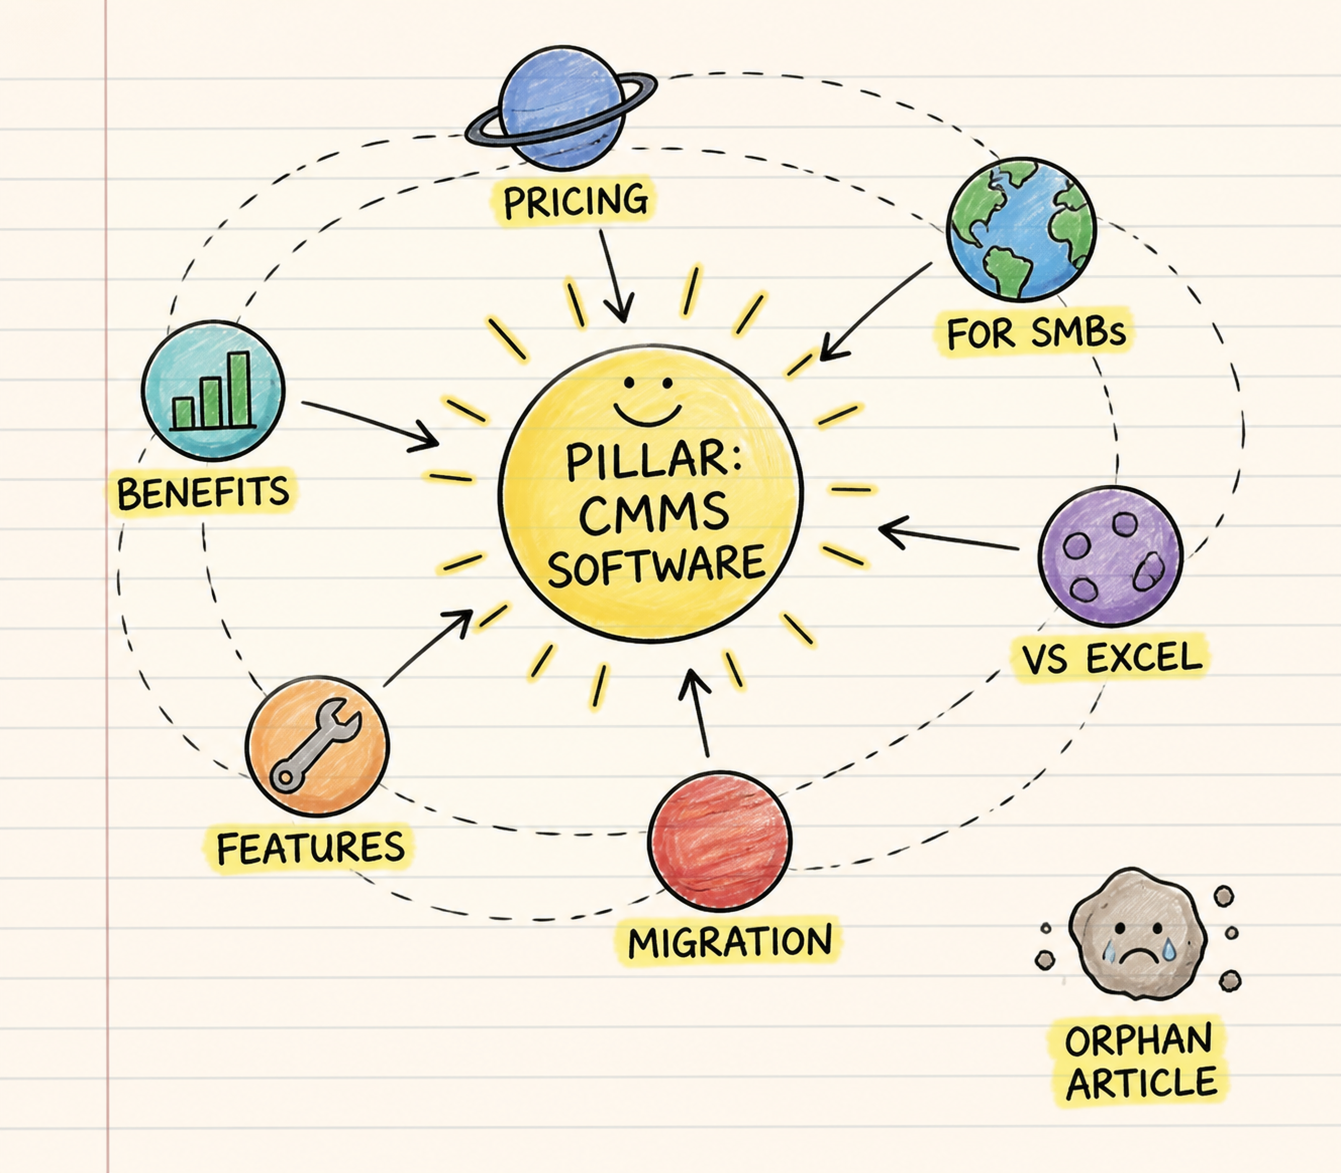
The intended effect: Google no longer sees a site that wrote an article about CMMS, it sees the reference on the CMMS topic. In B2B, where competing sites are often thin (a few product pages, an irregular blog), a complete cocoon of 15 to 30 coherent pages outranks established competitors within 6 to 12 months.
Two construction rules: Every cocoon has a written scope. One paragraph defining what the cocoon covers and what it does not. This scope is not decorative documentation: it is the control tool of the next step. Finish one cocoon before starting the next. Three cocoons at 30% completion rank worse than one complete cocoon. Topical authority comes from completeness. The production order follows business value: start with the cocoon containing the transactional queries closest to revenue.
Step 1.6: Lock in anti-cannibalization
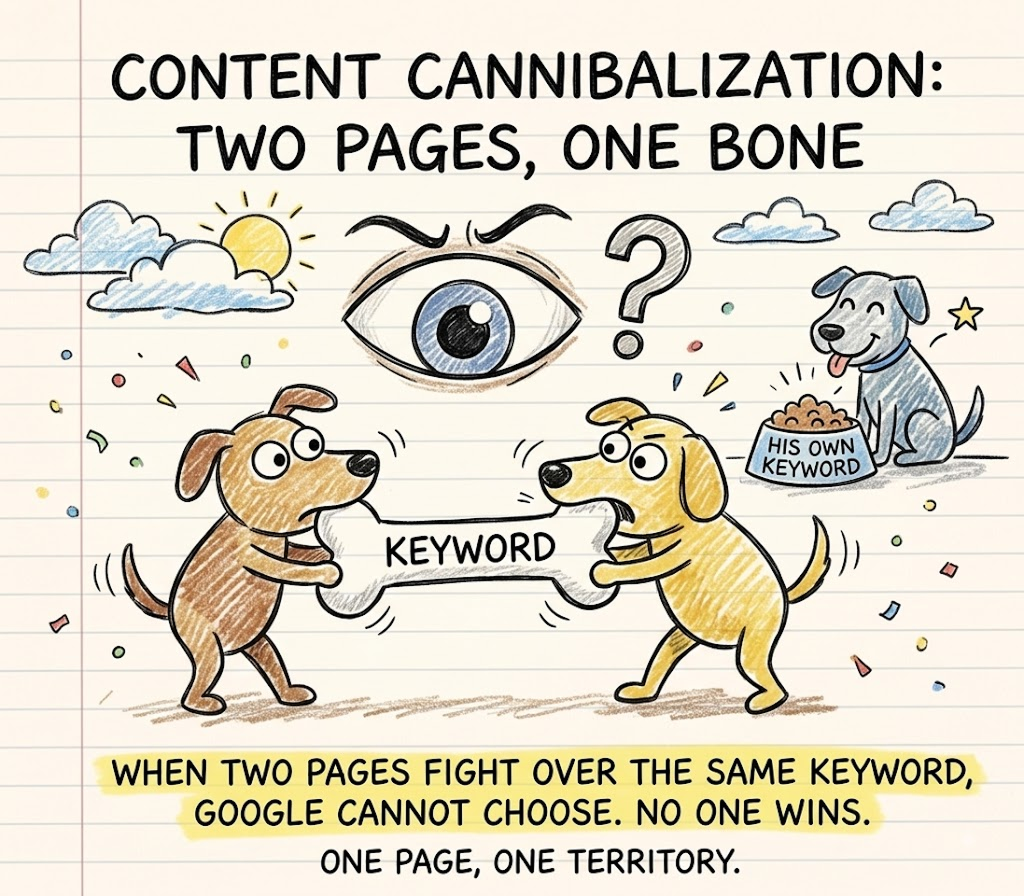
Cannibalization is the silent killer of B2B SEO. Two of your pages target the same keyword, Google hesitates between them, rankings oscillate, neither settles. On low-volume queries, nobody notices: each page gets a few impressions, the total looks normal, and the keyword that was supposed to bring leads brings nothing.
Prevention happens at design time, before production. Every planned page is compared to the written scope of its cocoon: is its angle inside the scope, and distinct from every other page of the site? Titles that drift get corrected. The whole site can be swept in one pass every time the architecture evolves. Result: every page of the site owns an exclusive keyword territory, guaranteed by construction.
(Detecting residual cannibalization, the kind that appears despite everything in real data, is handled in Phase 4.)
Three deliverables must exist before a single piece of content is produced: the complete site architecture, the persona × awareness matrix, and the data-backed justification (real volumes, analysis of real Google results) of every structural decision. If a decision cannot be traced back to a data point, it was made on intuition, and everything built on top of it will inherit that.
Phase 2: Produce content that beats the incumbents
The problem this phase solves
The B2B web overflows with decent content. Clean, well-written articles that say what everyone says. That content does not rank, and it is logical: Google has no reason to move a decent page above three decent pages already in place. To take a position, a page must bring something the incumbent pages do not.
Phase 2 industrializes that differentiation. Not as an intention (“we will do better”), as a measured process.
Step 2.1: Study the real competitors, page by page
Before writing a page, we extract and analyze the actual content of the pages occupying Google’s first page for the target keyword. Not a market impression, not a memory from past research: the exact text of the pages to beat, as it exists today.
This analysis produces three deliverables per page:
- Competitor coverage: what the incumbent pages cover, at what depth, in what format
- The gaps: questions searchers ask that no page in the top answers, missing data, ignored objections, untreated use cases
- The differentiation angle: the thesis your page will defend that nobody defends
A concrete example. On “CMMS vs Excel”, the incumbent pages list Excel’s missing features. None of them quantifies the real cost of maintaining an Excel system (data entry hours, errors, compliance failures). A page that brings that quantification, with a calculation method the reader can apply to his own case, has an objective reason to move ahead. That is what an angle is: not a different tone, a different contribution.
A point of vigilance: a competitive study has an expiration date. An analysis of Google’s first page made 6 months ago describes a landscape that no longer exists. Every study is dated, and any page produced more than a few months after its study justifies a fresh analysis.

Step 2.2: Brief with the double context
Every content brief is generated with two mandatory contexts.
The hierarchical context: the page knows its parent pillar, reuses its terminology, knows which sister pages it links to and which link back. No page is written in isolation. This is what makes internal linking natural to read instead of bolted on.
The persona context: the page knows its cell in the persona × awareness matrix. The brief specifies who it is written for, at what awareness level, with what vocabulary, which objections to handle, and which call to action. The writer, human or AI, guesses nothing.
The brief also embeds the deliverables of the competitive study: the gaps to cover become mandatory sections, the angle becomes the thesis of the outline.
And when the architecture evolves (an angle correction from anti-cannibalization, an adjusted cocoon scope), the affected briefs are regenerated. Content always follows architecture. Never the other way around.
Step 2.3: Produce in batches, with a measurable quality gate
Production runs in waves, cocoon by cocoon, in batches to keep the pace. But volume without control is a risk, not an asset: Google explicitly penalizes content produced at scale without added value (its “scaled content abuse” policy targets precisely the sites that mass-publish generic content, AI or not).
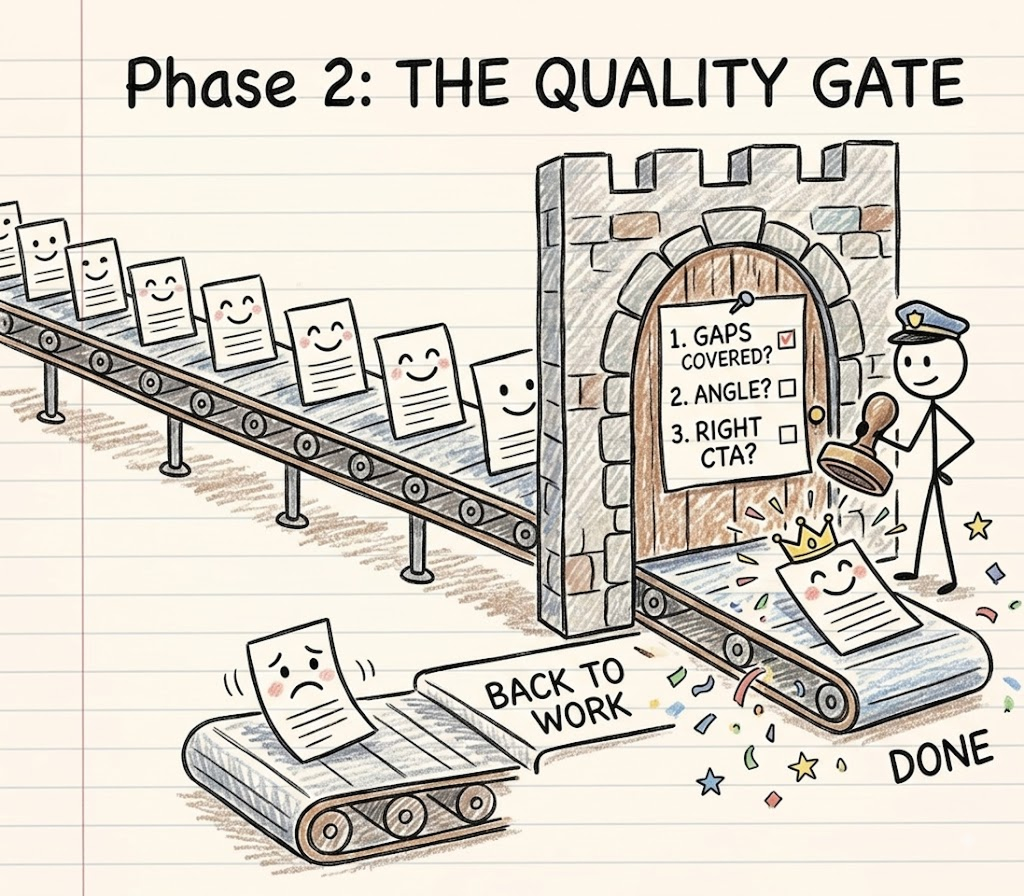
The defense is not to produce less. It is to make the added value verifiable. Every article passes a gate before publication: does it cover the gaps identified in its competitive study? Does it defend its angle? Does it respect the vocabulary and CTA of its persona cell? An article that fails goes back to production. The gate is binary and documented, not a gut-feeling proofread.
One clarification on AI writing, since the question comes up in every marketing department: Google does not penalize AI-written content, it penalizes content without added value, whatever its production method. An AI article built on a differentiating brief, fed by a fresh competitive study and checked against explicit criteria beats a generic human article. And vice versa. The variable is not who writes, it is what the process guarantees.
Last differentiation lever, the most defensible of all: internal experts. Thirty minutes interviewing an engineer, a senior technician or a salesperson per pillar page injects into the content a field experience no competitor can copy and no AI can invent: real cases, mistakes seen at customers, lived numbers. That is what turns a differentiated article into an unassailable one.
And a fair way to think about cost: the cost of content is not in its production, it is in its non-performance. A generic 100 euro article that never ranks costs more than a differentiated 400 euro article that takes a transactional position. The right question is never “how much does an article cost” but “what guarantees that this article has an objective reason to move ahead of the pages in place”.
Phase 3: Publish and connect the tracking
The problem this phase solves
Publication looks trivial: put it online, done. Yet this is the phase where two silent failures destroy entire programs without anyone seeing them.
Publication as a data event
Every published page is flagged as such in the steering system, ideally automatically through the CMS API (WordPress or other) rather than a manual checkbox someone forgets. This flag is not administrative: it is what triggers all the tracking of Phase 4. A page that is live but undeclared is a page the steering will never see.
Silent failure #1: non-indexation
This is the most serious blind spot in modern SEO, and almost no reporting shows it.
A published page is not automatically indexed by Google. Google discovers it, evaluates it, and decides whether or not to add it to its index. On a young or low-authority domain that publishes a lot, it is common for 40 to 60% of pages not to be indexed, sometimes for months. A non-indexed page does not exist: it can never rank for anything.
The trap: on a classic dashboard, a non-indexed page looks exactly like a page that ranks poorly. Zero clicks in both cases. You think you have a content problem, you have an indexation problem, and you spend months improving pages Google is not even looking at.
The countermeasure: the indexation rate per cocoon, checked systematically, as the program’s first metric. Every published URL is checked (indexed or not), and the rate rolls up per cocoon. A cocoon at 50% indexation calls for precise actions (reinforced internal links from the site’s strong pages, sitemap submission, improving the rejected pages) before any other optimization.

Silent failure #2: the phantom cocoon
All of Phase 1’s architecture rests on internal linking: satellites pointing to their pillar, pages accompanying the persona’s progression. That linking was planned. Was it actually implemented?
Between planning and go-live, there are integrators, CMSs, templates, oversights. A cocoon where 40% of the planned links do not exist in the published HTML is a cocoon on paper only: authority does not flow, the pillar concentrates nothing, and the structure that justified the whole investment does not exist in Google’s eyes.
The countermeasure: a technical crawl that compares planned links to the links actually present in the published pages, and reports the gap. This check goes together with hunting orphan pages (published pages that no internal link points to: invisible to Google and to visitors alike).
Three recurring checks summarize this phase: the publication flow automated through the CMS API, the weekly indexation check per cocoon, and the planned-vs-real linking audit after every publication wave. One hour a week that saves three months of blind debugging.
Phase 4: Steer over time
The problem this phase solves
Producing content, everyone can do. What separates an acquisition channel from a content expense is what happens after: measuring page by page, detecting declines before they cost, correcting, defending positions. Phase 4 is permanent. It is what turns the first three phases into an asset.
The foundation: match every planned page to its real URL
A technical detail with major business consequences. Your architecture contains planned pages; your site contains real URLs. For the steering to mean anything, every planned page must be matched to its URL, and to exactly one.
Matching is done by text similarity (a deterministic method, with a confidence score and manual validation of ambiguous cases), in strict one-to-one. That last point is the guardrail: without it, a generic URL of the site (a category page, an old blog post) absorbs the data of several planned pages, and the dashboard displays performance that does not exist. A report built on fuzzy matching is a lying report, with the best intentions in the world.
Real data, page by page
Once matching is in place, three data streams feed the steering continuously:
- Search Console: real average position, clicks, impressions for every page, query by query. This is the actual behavior of Google and of searchers, not a third-party tool’s estimate.
- Recurring technical crawl: broken links, duplicate tags, orphan pages, linking gaps. A site’s technical health degrades naturally as it lives (partial redesigns, deleted pages, modified templates); without a recurring crawl, the erosion is invisible.
- History: every metric is kept over time, page by page, to see trajectories rather than snapshots. A page at position 8 coming from 15 and a page at position 8 coming from 4 call for opposite decisions.
Alerts that detect trends, not noise
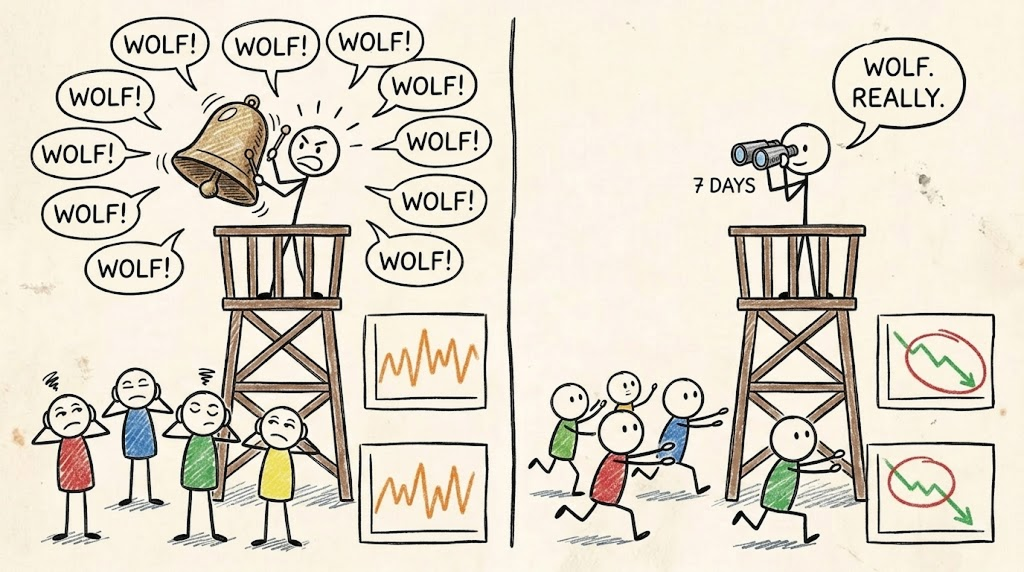
The naive reflex: alert as soon as a metric drops between two readings. The guaranteed result: a flood of false alerts. Google position is a query-weighted average that naturally fluctuates by several spots from one day to the next, especially on young pages and the low volumes typical of B2B. A system that cries wolf every morning will be ignored the day the wolf shows up.
The right mechanics: compare sliding windows (the last 7 days against the previous 7, or 28 against 28 for low-traffic pages) with significance thresholds. Alert on confirmed trends: a position that durably drops, clicks that collapse, technical problems that accumulate. Few alerts, all actionable.
Real cannibalization, detected continuously
Phase 1 prevented cannibalization by construction. Phase 4 detects the kind that appears anyway in real data: Google sometimes makes unexpected choices, and the site lives (new pages, forgotten old pages, product pages overflowing their role).
Detection crosses Search Console data with the page matching: when several URLs of the site receive significant impressions on the same query, there is effective cannibalization, however clean the architecture. The treatment is classic (merge, differentiate or redirect), but it is only possible if the detection exists. Prevention at design, detection in operation: both, never one without the other.
The correction loop: what keeps the asset alive
An alert that triggers nothing is a dead end. The full loop:
- Confirmed decline on a page (the windowed alert fires)
- Fresh competitive study launched on its keyword: Google’s first page may have changed, a competitor may have published something better, the intent may have shifted
- Update brief generated with the delta: what the current page covers, what the new competitive reality requires, the gap to close
- Content updated, republished, and back to tracking
This loop changes the nature of the program. Without it, positions naturally erode within 6 to 12 months (competitors publish, Google evolves, SERPs move) and content is an expense to renew. With it, positions are defended, the asset is maintained, and every euro invested in the early years keeps producing. That is the difference between buying content and building an asset.
One capacity rule follows from this loop: reserve 20 to 30% of production capacity for defending existing pages rather than creating new ones. It is counter-intuitive (creating always feels more productive than repairing) and it is systematically profitable: updating a page that already has history and links costs a fraction of a new page, for a faster effect.

The bridge to the business: conversion
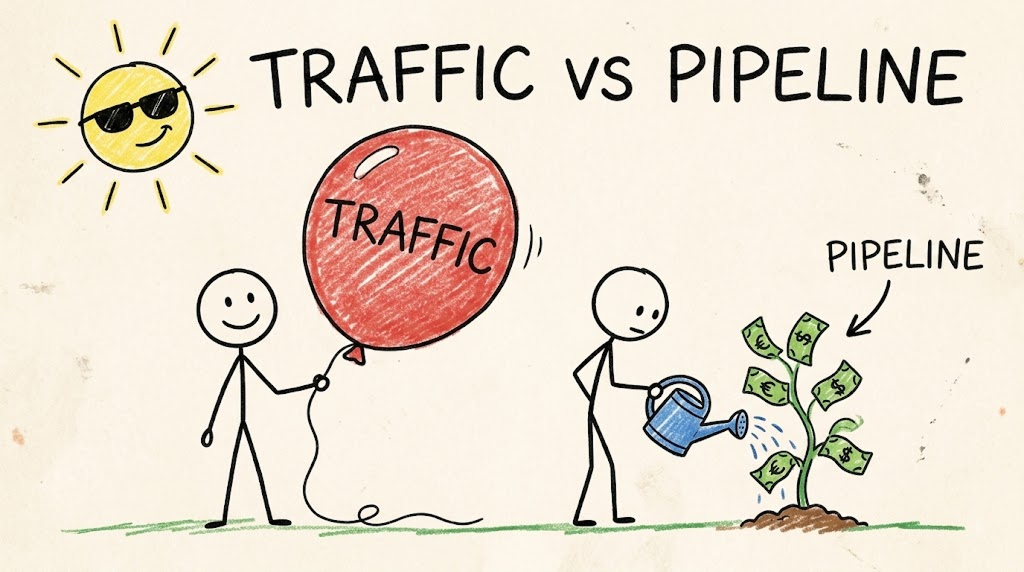
Position, clicks, impressions: all of that measures traffic. Nobody has ever paid an invoice with traffic. The final link of the steering connects every page to what it produces commercially: contact requests, audit or demo requests, meetings booked, per landing page.
This data (from the site’s analytics, even a minimal integration is enough) transforms the arbitrations. It reveals, for instance, that an informational satellite at 800 visits per month generates zero sales conversations while a transactional page at 60 visits generates four. Without this data, you reinforce the wrong page. With it, SEO is steered like a sales channel: by pipeline, not by traffic curves.
Governance: who does what, and how to choose
In-house, agency, or hybrid
Three models, one honest arbitration.
Fully in-house. Relevant from the moment SEO justifies a qualified full-time role (rarely before the channel is proven). Advantage: business knowledge stays inside. Risk: the profile that masters strategy, data, production and technical SEO at once is rare and expensive; the same seat held by a junior profile produces content, not a channel.
Fully agency. Relevant to launch fast with the complete method. The selection criterion is simple and brutal: ask to see the method, phase by phase, and the traceability of decisions. An agency that talks in “articles per month” sells production. An agency that starts with architecture, personas and data, and can show its steering (indexation, matching, alerts, correction loop) sells a channel.
Hybrid, the most frequent and often the healthiest model: the agency brings the method, the tooling and the production; the in-house side brings the business expertise (expert interviews, personas validated by sales, business arbitrations). Winning B2B content always mixes both: methodological rigor and the field knowledge no vendor possesses.
The questions that unmask a vendor in 10 minutes
- “What do you deliver before writing the first article?” (Expected: complete architecture, persona matrix, supporting data. Red flag: “we start publishing in week 2”.)
- “How do you decide that two keywords go on the same page?” (Expected: analysis of real Google results. Red flag: “our expertise” or “our AI”.)
- “What is your indexation rate on your current programs?” (Expected: a number. Red flag: not understanding the question.)
- “How do you detect cannibalization?” (Expected: prevention at design AND detection in Search Console data. Red flag: “we are careful”.)
- “Show me a decline alert and the correction it triggered.” (Expected: a documented example. Red flag: reporting that stops at traffic curves.)
- “What do you commit to?” (Expected: the method, the deliverables and the timelines. Red flag: a ranking guarantee, which nobody can honestly give.)

The KPIs, in the order they matter
- Indexation rate per cocoon. The foundation metric: without indexation, everything else is null by construction.
- Rankings on transactional and product-aware keywords. The level 4 and 5 queries, the ones that touch revenue. Tracked individually, never as an average.
- Clicks on commercial and transactional pages. Qualified traffic. Informational traffic is tracked too, but as an authority indicator, not a performance one.
- Conversions per landing page. Contact, audit and demo requests. The only line leadership should look at first. 500 clicks on a problem-level article are worth less than one audit request.
- Coverage of the persona × awareness matrix. The percentage of strategic cells covered by at least one published and indexed page. This is the progress measure of the strategy itself.
- Technical health. Broken links, orphan pages, planned-vs-real linking gap. A cocoon with holes loses the authority it cost to build.
Total traffic is not on the list, deliberately. In B2B, it is the most flattering and least meaningful metric: it rises easily on informational content that will never see a buyer.
The realistic timeline, month by month
Weeks 1 to 3: architecture. Keyword import and scoring, clustering validated by the SERPs, personas and awareness matrix, cocoons, anti-cannibalization. Zero content published. Deliverables: the complete architecture and the production plan ordered by value.
Months 1 to 3: first waves. Production and publication of the first cocoon (the one closest to revenue), competitive studies in support, then the second. Steering setup: matching, Search Console, indexation checks, crawl. First impressions in Search Console around weeks 4 to 8: that is the signal Google is discovering the structure, not yet a result.
Months 3 to 6: measurable traction. First page-one rankings on niche queries, indexation rate climbing (target: above 80% on mature cocoons), first alerts and first correction loops. First conversions arrive, usually on transactional pages before the others.
Months 6 to 12: cruising speed in construction. Complete cocoons settle, transactional positions are taken, the organic pipeline becomes a measurable line in the sales reporting. Next cocoons open based on real data, not on the initial plan: 6 months of data beat day-one hypotheses.
Beyond 12 months: the asset. The share of capacity devoted to defense (updates triggered by alerts) rises to 20-30%. The channel’s marginal cost drops, its output rises: that is the definition of an asset.
Any promise significantly faster than this, on a domain with no pre-existing authority, is a red flag, not good news.
The 8 mistakes that doom a B2B SEO program
- Writing before architecting. Content without structure produces cannibalization, capped rankings, and 12 lost months. This is the mother of all mistakes, the one most others descend from.
- Picking keywords by volume. In B2B, a 70-searches-per-month keyword can be worth more than all your current traffic. The intent and the value of the searcher outrank volume, always.
- Writing for “the market” instead of one precise persona. A page that talks to everyone convinces no one, and a CTA mismatched to the awareness level destroys conversion in both directions (too early: the reader flees; too late: the hot deal walks).
- Ignoring indexation. Publishing 100 pages of which 50 are not indexed means paying full price for half a program without knowing it, and optimizing for months pages Google is not even looking at.
- Duplicating the top 3. One more decent page has no objective reason to move ahead of the decent pages in place. Without a gap covered or an angle defended, production is an expense.
- Publish and forget. Without steering and a correction loop, positions erode within 6 to 12 months and the investment depreciates like a machine without maintenance.
- Measuring traffic instead of pipeline. Total traffic is the complacency metric. The only SEO that counts is the one that generates sales conversations, and that is measured per page.
- Making structural decisions on intuition or unconstrained AI. Every architecture decision must be traceable to a real data point: volume, analysis of real Google results, Search Console. What cannot be traced cannot be steered.
In summary: the overall logic
The method fits in one sentence: each phase feeds the next with real data instead of assumptions.
Keyword scoring comes from real volumes and real commercial value. Grouping comes from statistical clustering validated by real Google results. The architecture comes from that grouping, mapped onto the real journey of every persona in the buying committee. Content comes from that architecture and from the analysis of the real competing pages, with differentiation verified before publication. Steering comes from real online behavior: real indexation, real Search Console data, real conversions. And corrections come from the steering, in a loop, indefinitely.
At no point does a structural decision rest on an intuition, a habit, or a random AI generation. That is what makes the method auditable by a CEO, steerable by a marketing director, transferable between teams, and defensible in front of a board with something better than traffic curves.
B2B SEO run this way is not a marketing expense line. It is the construction of an acquisition asset: slow to build, cheaper and cheaper to maintain, and productive for years.
Key takeaways
B2B SEO run this way is not a marketing expense line. It is the construction of an acquisition asset.
The complete method for building an organic acquisition channel that generates sales pipeline, not traffic.